In a recent project, the client asked Maderas Partners to run a series of calculations related to their employees’ work history. The calculations themselves were rather basic. However, the real challenge was organizing the dataset in such a way that allowed for the calculations to be run for all employees over the entire time period.
Note: As always, the data in this example have been fully anonymized.
Task:
- Convert very irregular shift data for 173 employees into an easily readable format
- Perform the following calculations for each shift: total length of shift, length of lunch break, amount of time worked prior to lunch, amount of time worked following lunch
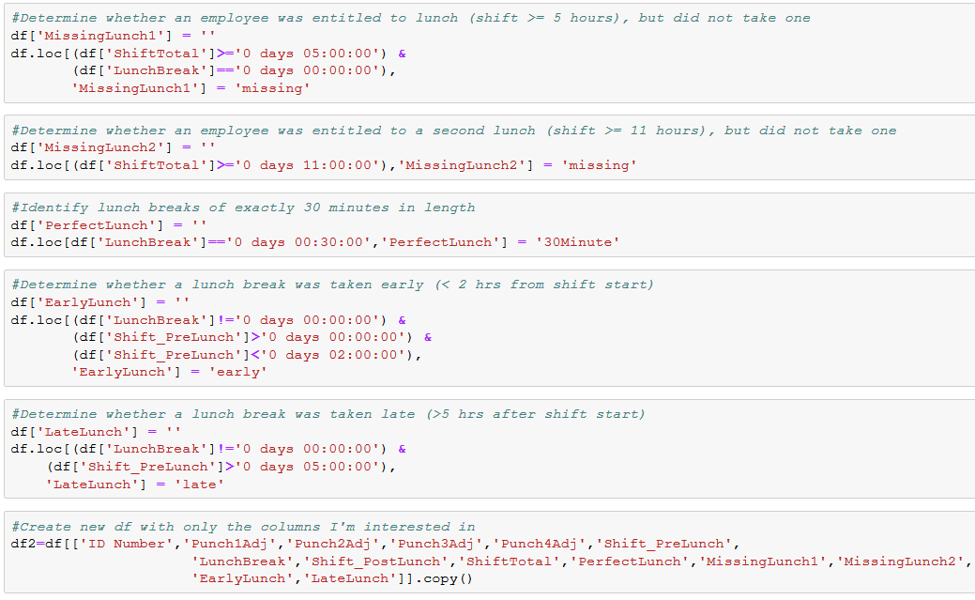
- Determine the following characteristics of each shift: lunch breaks that were exactly 30 minutes in length, shifts long enough to qualify for lunch but no lunch was taken, lunch breaks that occurred very early in the shift, and lunch breaks that occurred very late in the shift.
Primary challenge: A very irregular dataset
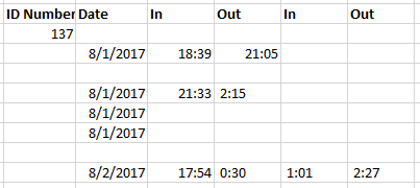
This sample dataset runs from August-December 2017 and is arranged by employee. For example, the dataset lists all shifts worked by Employee #1 from August-December 2017 and then lists all shifts for Employee #2, then Employee #3, and so on. However, the employee number is only listed once at the very start of that employee’s data.
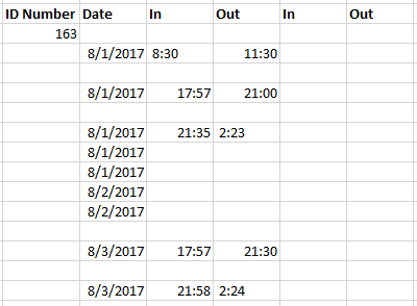
Employees of this company often worked split shifts, e.g. an employee with an 8-hour shift working 3 hours in the morning and then returning to work several hours later that day to complete the remaining 5 hours. In the above example, Employee #163 worked a split shift on 8/1/2017, but a regular shift with a 28-minute lunch break on 8/3/2017.
Additionally, shifts are sometimes split between two lines at the lunch break or shift split, but at other times, they are all listed on a single line
Python Script
Given the tasks and challenges, we decided that Python 3 was best suited for this analysis.
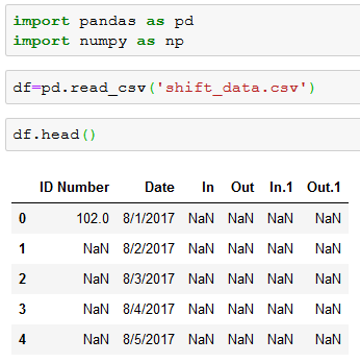
The first task was to fill in the missing employee numbers so that each shift was matched to an employee. Also, as you can see in the examples above, there are a lot of empty lines and lines with dates but no shift data.
Here is how the raw dataset appears in a pandas dataframe:
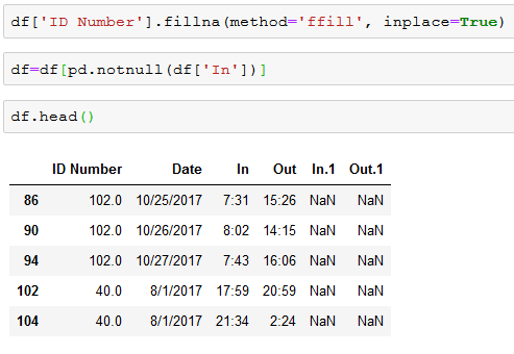
Our first step was to fill in the missing ID numbers and delete all blank spaces. The script below deletes all rows that have no data for the first clock in time at the start of the shift (“In”):
Next, we transformed the basic time data into datetime by combining the date column and each punch of the clock to form four new columns: Punch 1-4
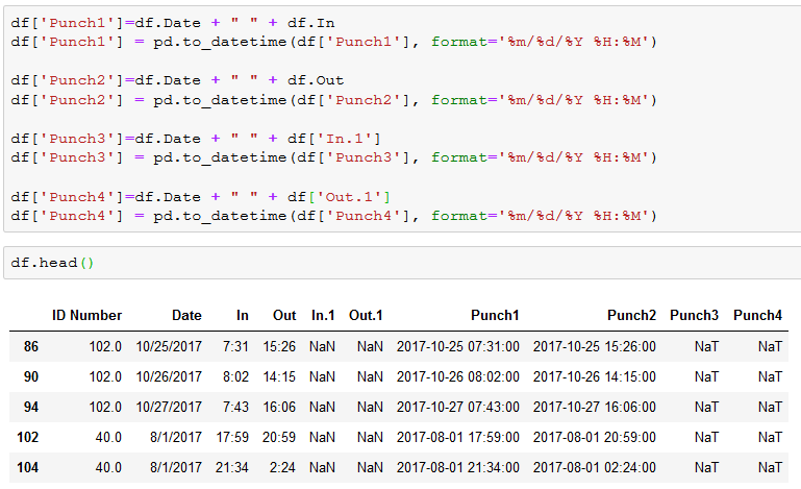
In order to make this easily readable for the client and easier to perform subsequent calculations, we wanted the shifts that were separated on several lines for the same day to all be on the same line. We grouped the data by ID Number and Date and then created two new columns: Punch 3a and 4a.

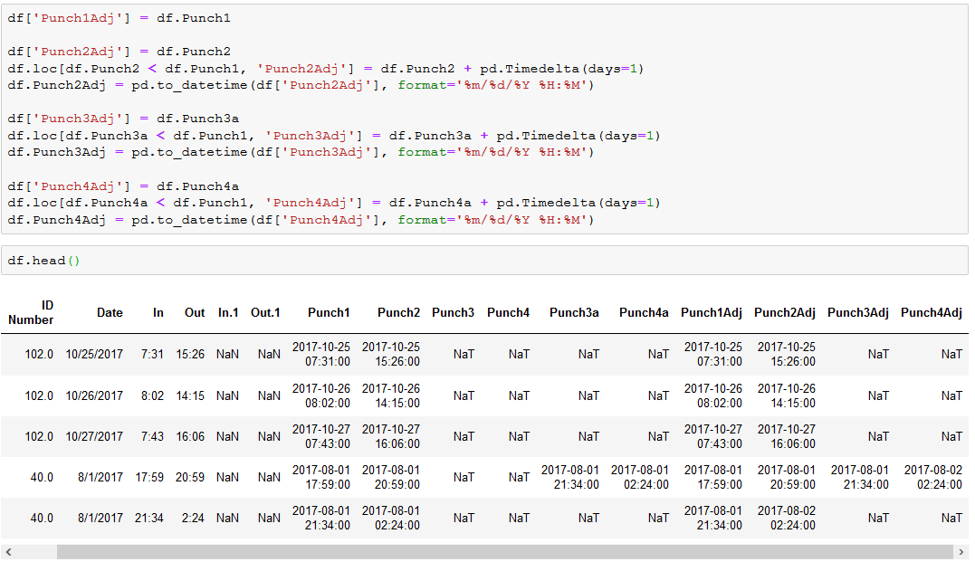
You’ll notice on line 102, that we pulled the information from Punch 1 and 2 from line 104 and applied it to Punch 3a and 4a. This transformed each workday from split between two lines to just one. This brought to light a new problem that will present itself once we begin calculating the length of each shift. Notice on line 102 that the final clock out (Punch 4a) occurred at 2:24am on 8/2/17 but the date is listed as 8/1/17, the date that the shift began. Leaving the date as such will make it impossible to accurately calculate the full shift length in Python. Therefore, we wrote the following code to check whether the time in Punches 2-4 was less than that of Punch 1 and if so, add 1 day onto the date. We then created 4 new columns to include any date adjustments: Punch 1Adj-4Adj
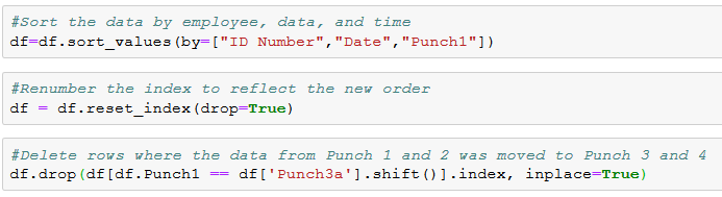
Compared to the previous example, the final clock out on line 102 is now 8/2/2017, with Punches 1-3 occurring on 8/1/2017. At this point, there are still two lines for this shift: one with the data as it originally was (the last line in the example above) and one with the data from Punch 1 and 2 moved to Punch 3 and 4. To clean this up, we used the following code:
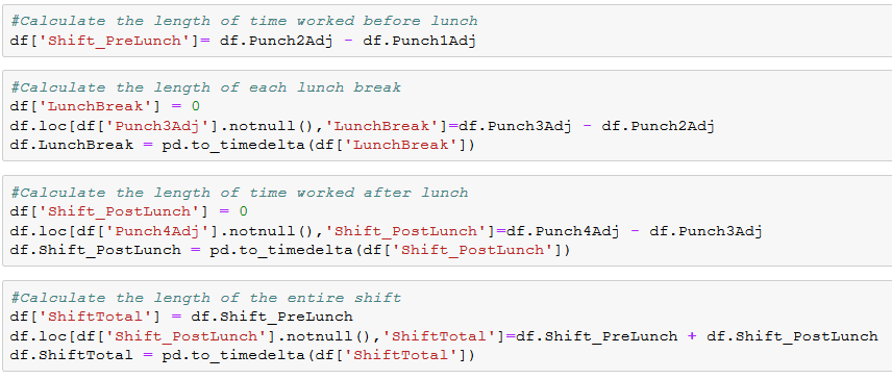
At this point, the hard part (Task 1) is over: the employee numbers have been filled in, blank lines have been deleted, each shift is presented on a single line, and dates for shifts that extend past midnight have been adjusted as necessary. We are now working with a clean, well-organized dataset with no empty spaces and no duplicates. What comes next is series of fairly simple calculations to satisfy Tasks 2 and 3, as listed at the top of the post.
There you have it. With the above Python script, we were able to take the raw Excel files furnished by the client and transform them into a single, easily read dataframe. Please see our Github page for the raw data sample and the finished product.
End Notes
While we used the structure of the dataset in its original form, the data, including employee ID numbers, have been anonymized.
The full Python code and sample dataset can be found on Github. The above represents the bulk of the analysis that we ran, but there were some additional clean up and adjustments that were made that are not reflected here or on Github.